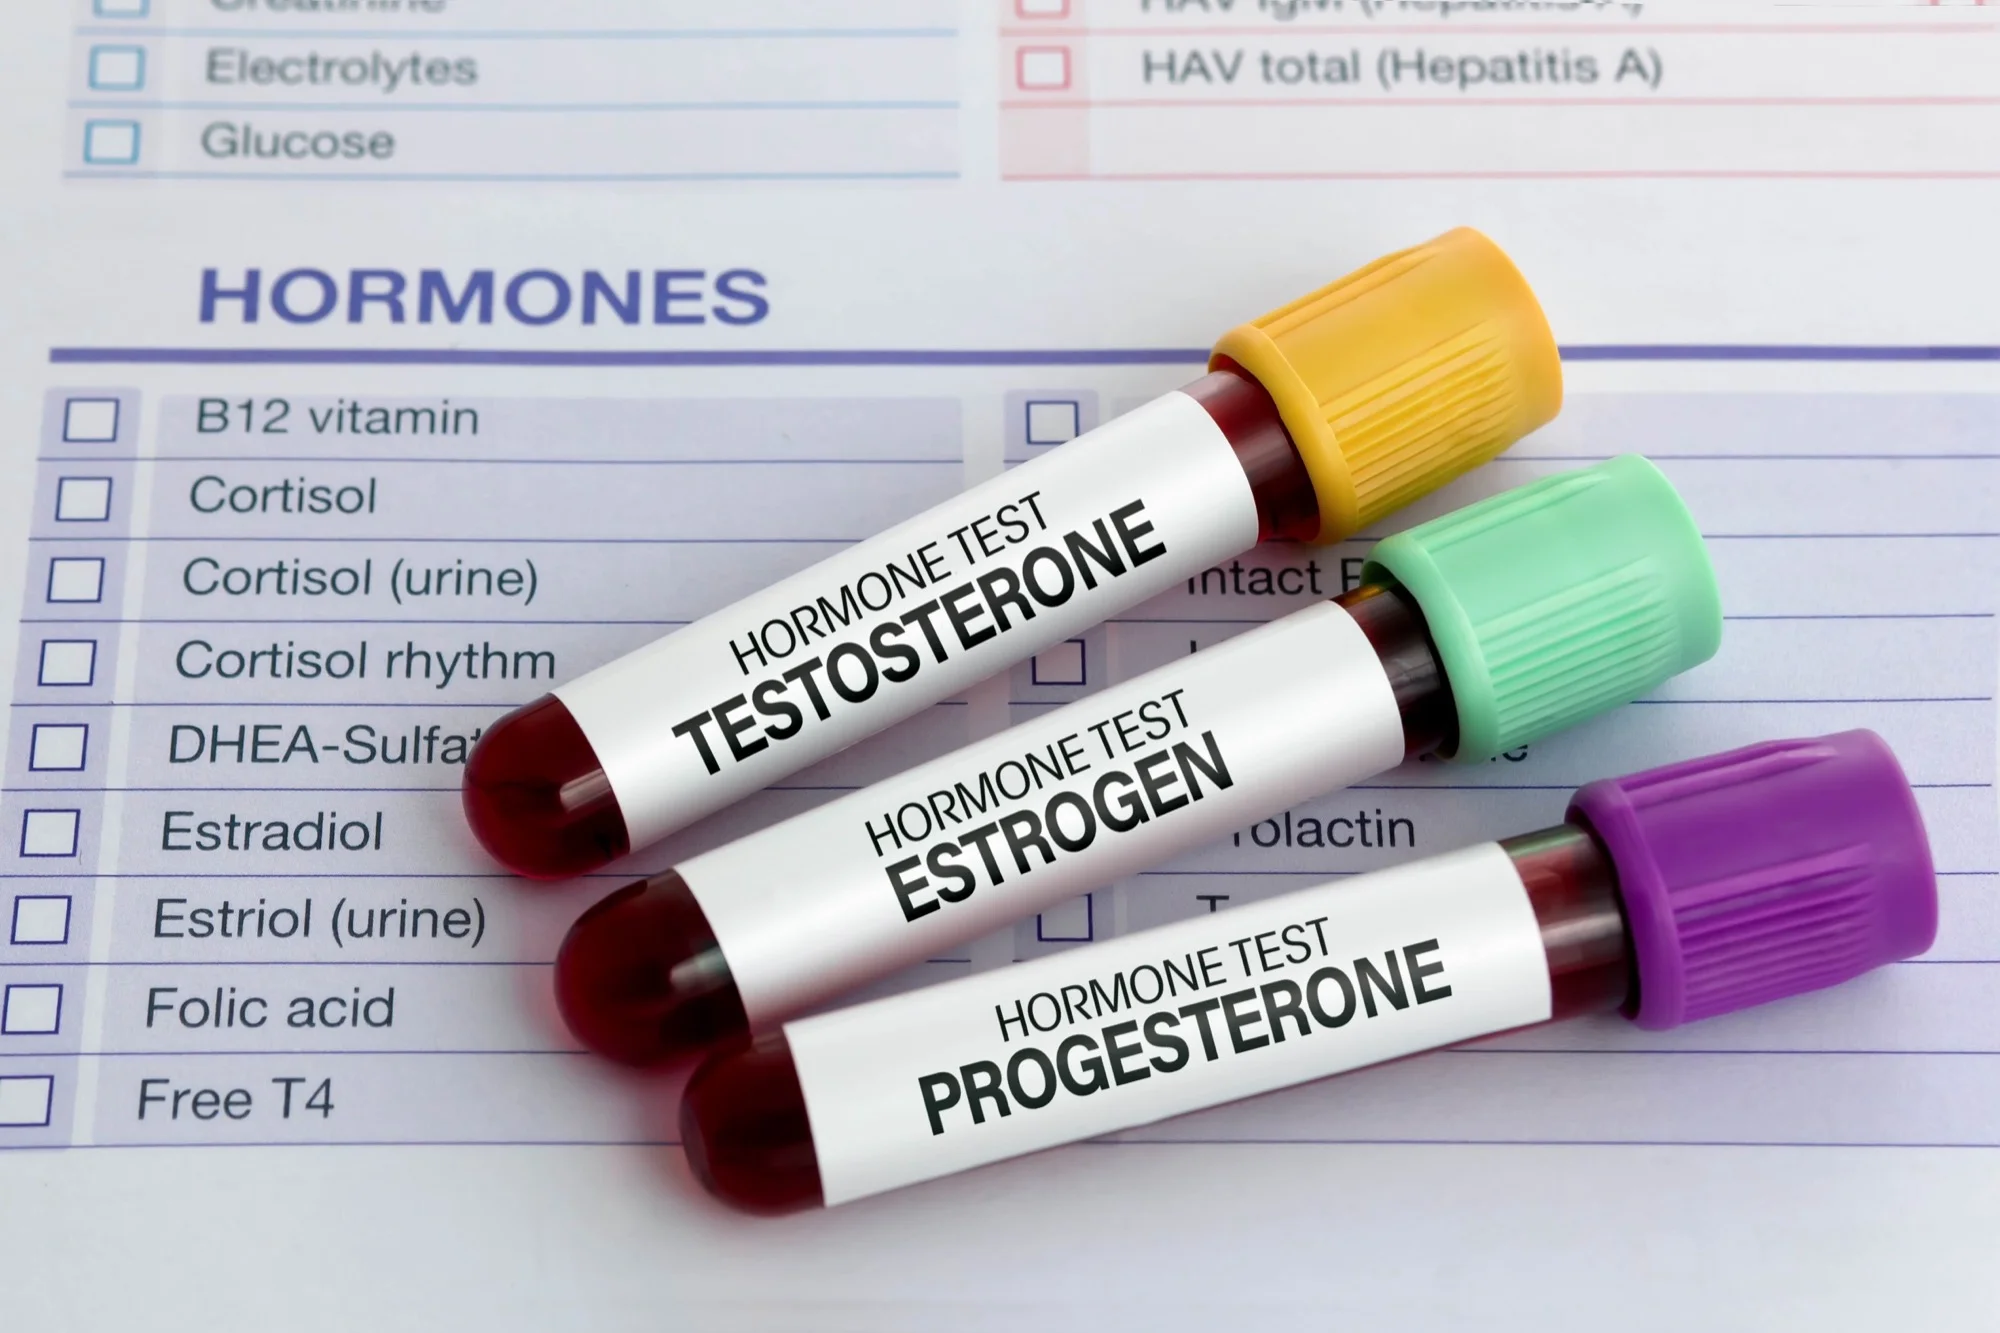
Diagnostics & Testing
Optimal vs Normal Lab Ranges
Your labs came back "normal." But you still feel tired, foggy, and off. Here's why "normal" doesn't mean what you think it means—and what to look for instead.
Medically reviewed by Missy Zammichieli, DNP, APRN, FNP-BC · Updated March 2, 2026
THE PROBLEM WITH "NORMAL"
You go to the doctor because you're exhausted, gaining weight, losing motivation, and can't think clearly. They run bloodwork. A few days later: "Everything looks normal." End of conversation.
This happens constantly. And the reason is simple: your doctor is using reference ranges designed to detect disease, not optimize health.
HOW LAB REFERENCE RANGES ARE BUILT
When you see a "normal range" on a lab report, here's how it was determined:
Step 1: Test a Large Group of People
Labs collect results from a large reference population. This population includes healthy people, sick people, people on medications, sedentary people, elderly people—essentially everyone who got that test done.
Step 2: Take the Middle 95%
The reference range is defined as the middle 95% of results (2 standard deviations from the mean). The top 2.5% and bottom 2.5% are cut off and flagged as "abnormal."
Step 3: Call It "Normal"
If your result falls within that range, it's reported as normal. If it falls outside, it gets flagged. Your doctor reviews flagged values. Unflagged values are usually not discussed.
Here's the problem: "Normal" just means "statistically common in the tested population." It doesn't mean healthy. It doesn't mean optimal. And because the reference population includes unhealthy people, the range is wider than it should be. A 45-year-old man with a testosterone of 310 ng/dL is "normal" by lab standards—but that same level is associated with fatigue, low libido, brain fog, and metabolic decline.
THE GAP BETWEEN "NOT SICK" AND "ACTUALLY WELL"
Conventional medicine is built around a binary: sick or not sick. If your labs don't indicate disease, you're "fine." But there's a massive spectrum between disease and optimal health—and that's where most people live.
Disease
Below Range
Flagged on labs
Suboptimal
"Normal" But Symptomatic
Not flagged. Still a problem.
Optimal
Best Health Outcomes
Where you want to be
Excess
Above Range
Flagged on labs
The yellow zone is where most frustrated patients live. Their labs aren't alarming enough to trigger treatment, but they're far enough from optimal to cause real symptoms. Performance medicine focuses on that gap.
WHERE IT MATTERS MOST
Here are the biomarkers where the gap between "normal" and "optimal" has the biggest practical impact on how you feel.
Testosterone (Men)
Lab "Normal"
300–1000 ng/dL
Optimal
500–900 ng/dL
Symptomatic Zone
300–500 ng/dL
A 40-year-old man with a total testosterone of 350 ng/dL is technically "normal." He's also likely experiencing fatigue, low libido, brain fog, and difficulty maintaining muscle. The lab won't flag it. His doctor won't treat it. But at 600+ ng/dL, those symptoms often resolve. Free testosterone matters too—total can look normal while free T is low.
TSH (Thyroid)
Lab "Normal"
0.5–4.5 mIU/L
Optimal
1.0–2.0 mIU/L
Symptomatic Zone
2.5–4.5 mIU/L
TSH (thyroid stimulating hormone) is the standard thyroid screening test—and one of the most frustrating. A TSH of 4.0 is "normal" but can cause fatigue, weight gain, cold intolerance, hair loss, and depression. Many endocrinologists now agree that TSH above 2.5 warrants investigation, especially if symptoms are present. And TSH alone doesn't tell the full story—Free T3 and Free T4 matter too.
Vitamin D (25-OH)
Lab "Normal"
30–100 ng/mL
Optimal
50–70 ng/mL
Symptomatic Zone
30–50 ng/mL
A vitamin D of 32 ng/mL is "normal" but associated with suboptimal immune function, mood issues, and poor bone health. Most people in northern climates (like Chicago) are in this range or below. Research consistently shows better outcomes at 50-70 ng/mL for immune function, mood, bone density, and overall health.
Fasting Insulin
Lab "Normal"
2.0–25.0 uIU/mL
Optimal
2.0–8.0 uIU/mL
Early Warning Zone
10–25 uIU/mL
This one is critical—and most doctors don't even order it. Fasting insulin above 10 suggests your body is working overtime to manage blood sugar, even if your glucose looks fine. By the time glucose goes abnormal, insulin resistance has been building for years. Fasting insulin is an early warning system for metabolic disease. A level of 20 is "normal" but screaming that something is wrong.
Ferritin (Iron Stores)
Lab "Normal"
12–300 ng/mL
Optimal
50–150 ng/mL
Symptomatic Zone
12–50 ng/mL
The normal range for ferritin is absurdly wide: 12-300 ng/mL. A woman with a ferritin of 15 is "normal" but almost certainly experiencing fatigue, hair loss, poor exercise tolerance, and brain fog. Iron deficiency is the most common nutritional deficiency worldwide, and it's routinely missed because the reference range starts too low. This is especially common in menstruating women and active people.
Hemoglobin A1c
Lab "Normal"
Below 5.7%
Optimal
Below 5.3%
Watch Zone
5.4–5.6%
A1c measures your average blood sugar over ~3 months. Below 5.7% is "normal," 5.7-6.4% is "prediabetes," and above 6.5% is diabetes. But an A1c of 5.6% isn't cause for celebration—it's a warning sign that metabolic health is trending the wrong direction. By the time you hit 5.7%, damage has already been accumulating. Optimal is below 5.3%.
hs-CRP (Inflammation)
Lab "Normal"
Below 3.0 mg/L
Optimal
Below 1.0 mg/L
Elevated Risk Zone
1.0–3.0 mg/L
High-sensitivity C-reactive protein measures systemic inflammation. Levels between 1-3 mg/L represent moderate cardiovascular risk, but they're "normal." Chronic low-grade inflammation drives aging, metabolic disease, and cardiovascular events. Optimal is below 1.0 mg/L—which is achievable through diet, exercise, sleep, and addressing underlying causes.
WHY THIS MATTERS
This isn't about being neurotic or chasing perfect numbers. It's about understanding that your labs are a map—and the conventional approach reads the map at too low a resolution.
It Explains Symptoms
If you've been told "your labs are fine" but still feel terrible, the answer is often hiding in the gap between normal and optimal. Suboptimal thyroid, borderline testosterone, low-normal iron, or creeping insulin resistance can each cause real symptoms. Together, they compound.
It Catches Problems Early
A fasting insulin of 18 won't trigger a diagnosis. But it tells you that metabolic dysfunction is building. A vitamin D of 25 won't flag as deficient at most labs. But it tells you that immune function, mood, and bone health are compromised. Optimal ranges function as an early warning system.
It Drives Better Decisions
When you see the full picture at higher resolution, treatment decisions become clearer. Instead of "your testosterone is normal," you see "your testosterone is in the bottom 15th percentile for your age, your free T is low, and your SHBG is high—here's why you feel like this and here's what we can do."
It Creates Accountability
When you track biomarkers over time against optimal targets, you can measure whether interventions (lifestyle changes, supplements, medications) are actually working. Numbers don't lie, and trends tell a story that single snapshots miss.
HOW WE USE THIS AT MOONSHOT
Our entire model is built on this distinction. Every patient gets a comprehensive panel that goes far beyond standard lab work—and every result is interpreted through an optimal lens, not just a reference range.
We Test More
Standard physicals might check a CBC, metabolic panel, and maybe a lipid panel. We add hormones (total and free testosterone, estradiol, DHEA-S, progesterone), thyroid (full panel, not just TSH), metabolic markers (fasting insulin, A1c, HOMA-IR), inflammation (hs-CRP), vitamins (D, B12), and iron studies.
We Interpret Differently
We review every marker against optimal targets, not just reference ranges. We look at patterns across markers—for example, a TSH of 3.5 with fatigue and low-normal Free T3 tells a different story than a TSH of 3.5 with no symptoms and strong Free T3.
We Track Over Time
A single lab draw is a snapshot. We track trends over time—how markers respond to treatment, how they shift with lifestyle changes, and whether you're moving toward or away from optimal. This is how you actually manage health, not just check boxes.
WHAT YOU CAN DO RIGHT NOW
Even if you don't come to Moonshot, here are steps you can take with your current provider:
1. Get Your Actual Numbers
Don't accept "everything's normal." Ask for a copy of your results—you're entitled to them. Look at the actual values, not just the in-range/out-of-range flags.
2. Ask for a Full Panel
Request: total and free testosterone (yes, even women), full thyroid panel (TSH + Free T3 + Free T4), fasting insulin (not just glucose), vitamin D, ferritin, and hs-CRP. Most doctors will order these if you ask.
3. Compare to Optimal Ranges
Use the ranges in this article as a starting point. If your values are "normal" but fall in the symptomatic zones described above, that's worth a conversation with a provider who takes optimization seriously.
4. Track Your Trends
Get labs done at regular intervals (every 3-6 months if actively optimizing, annually at minimum). Compare your results over time. A testosterone dropping from 550 to 380 over two years is a meaningful trend—even though both are "normal."
COMMON QUESTIONS
Is this just "functional medicine" / alternative medicine?
No. Optimal ranges aren't fringe—they're based on the same peer-reviewed research that informs conventional medicine. The difference is in how the data is applied. We use the same evidence base; we just set the bar at "where health outcomes are best," not "where disease is absent." Many endocrinologists, cardiologists, and sports medicine doctors use these tighter ranges in their practice.
Will my insurance cover the additional tests?
It depends on the test and your insurance. Basic hormones, thyroid panels, and metabolic markers are typically covered, especially with appropriate diagnostic codes. Some specialized markers may not be. At Moonshot, our comprehensive panel is included in your membership—no insurance hassle.
How often should I get labs done?
If you're starting a new treatment (hormone therapy, weight loss, etc.): every 6-8 weeks initially, then every 3-6 months once stable. For general health monitoring: every 6-12 months. If something was flagged as suboptimal and you made changes: recheck in 8-12 weeks to see if it moved.
Can I over-optimize? Is there such a thing as too many labs?
Yes, there's a point of diminishing returns. The goal is informed decision-making, not obsessive tracking. A comprehensive panel 2-4 times per year gives you the data you need. What matters is acting on the data—not just collecting it.
References
- 1. Bhasin S, et al. "Reference ranges for testosterone in men generated using liquid chromatography tandem mass spectrometry." J Clin Endocrinol Metab. 2011;96(8):2430-2439.
- 2. Garber JR, et al. "Clinical practice guidelines for hypothyroidism in adults." Thyroid. 2012;22(12):1200-1235.
- 3. Holick MF. "Vitamin D deficiency." N Engl J Med. 2007;357(3):266-281.
- 4. Kraft HPJ. "Detection of diabetes mellitus in situ (occult diabetes)." Lab Med. 1975;6:10-22.
- 5. Ridker PM. "C-reactive protein: a simple test to help predict risk of heart attack and stroke." Circulation. 2003;108(12):e81-e85.
- 6. Mullur R, et al. "Thyroid hormone regulation of metabolism." Physiol Rev. 2014;94(2):355-382.
- 7. Camacho PM, et al. "American Association of Clinical Endocrinologists Guidelines for Comprehensive Diabetes Management." Endocr Pract. 2020;26(Suppl 3):1-203.
WANT THE FULL PICTURE?
Our comprehensive panel tests what matters—and we interpret every marker against optimal targets, not just reference ranges.
Book Consultation