Report Walkthrough
YOUR DEXA REPORT, EXPLAINED
Every page of your Moonshot Medical DEXA report, explained with a real sample patient — so you know exactly what you'll get and what each number means.
Download Sample Report (PDF) ↓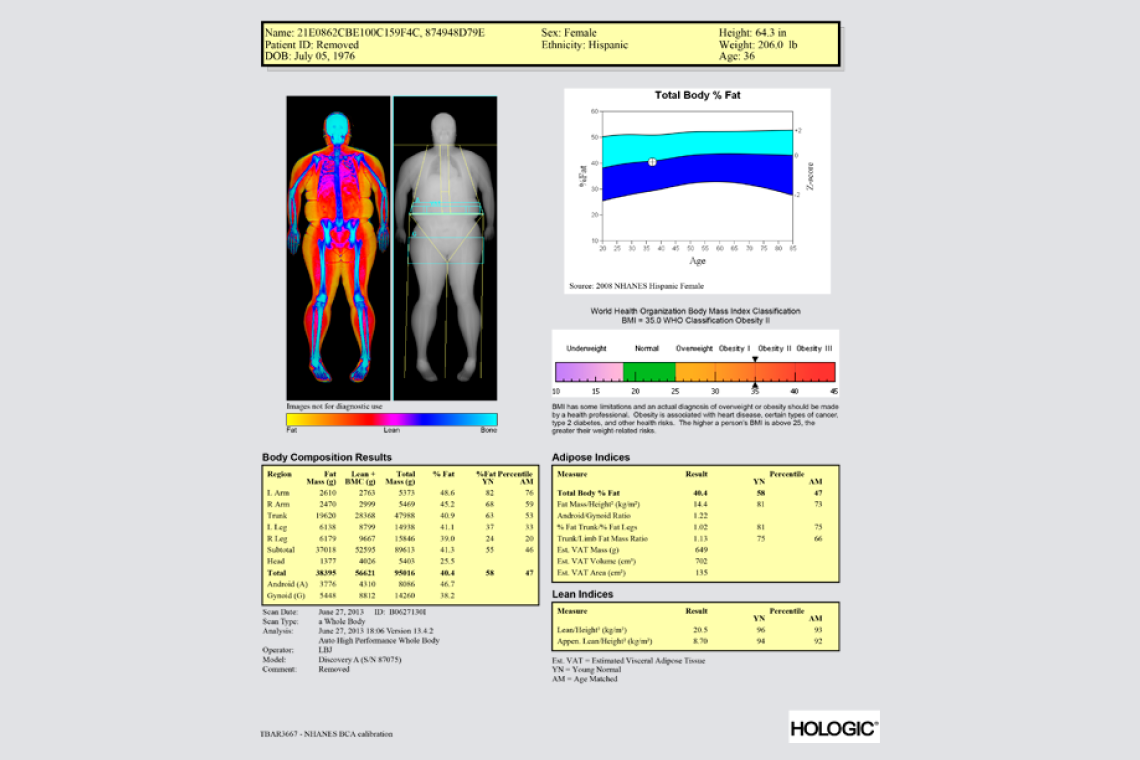
A DEXA scan (dual-energy X-ray absorptiometry) uses low-dose X-rays to measure exactly how much fat, muscle, and bone you have — and where it's distributed across your body. It takes about 7 minutes, you lie still on a padded table, and the radiation exposure is less than a cross-country flight.
Our sample patient is Jane Doe — a 49-year-old female, 5'5", 140 lbs. Her results are typical for someone who is active but hasn't focused on body composition. We'll use her numbers to walk through what each section of the report tells you.
Page 1
THE OVERVIEW
The first page is your snapshot. Four key metrics at a glance, plus your body composition images.
The Big Four:
What percentage of Jane's total body weight is fat tissue. For reference, a healthy range for women 40–49 is roughly 23–34%. Her report flags this as "Elevated."
Everything that isn't fat: muscle, organs, water, connective tissue. This is 61.8% of her total weight (including bone mineral — the composition bar below separates bone out as its own category).
The total weight of adipose tissue in Jane's body. This includes both subcutaneous (under-the-skin) and visceral (around-the-organs) fat.
A quick-read status based on her Z-score. More detail on this appears later in the report.
The Composition Bar
Below the metrics, a horizontal bar shows the proportion visually: 38.2% fat, 58.7% lean, and 3.1% bone mineral. This gives you an intuitive feel for the ratio.
Body Images
Two images from the DEXA scanner appear on page 1:
- Composition Colormap — A heat-map overlay showing fat distribution across your body. Warm colors (red/orange) indicate higher fat concentration; cool colors (blue/green) indicate lean tissue.
- Region Markers — An outline view showing how the scanner divides your body into regions (arms, legs, trunk, head) for the detailed regional analysis later in the report.
BMI note: Jane's BMI is 23.6 — technically "normal." But her body fat is 38.2%, which is elevated. This is exactly why DEXA matters: BMI tells you nothing about composition. Two people with the same BMI can have very different body fat levels.
Page 2
WHERE YOU STAND & VISCERAL FAT
Population Percentile Rankings
This table answers the question: How do I compare? Your metrics are ranked against data from a large national health survey, broken into three groups: young adults (20–39), your age group, and all adults.
Higher percentile = better for every row. If your body fat score is 60, you're leaner than 60% of that group. If your muscle score is 60, you carry more muscle than 60%.
| Metric | Young Adults (20–39) | Your Age Group | All Adults |
|---|---|---|---|
| Body Fat % (38.2%) | ~40th | ~60th | ~55th |
| Lean Mass Index (14.47) | ~31st | ~31st | ~31st |
| Visceral Fat (102.5 cm²) | ~31st | ~63rd | ~51st |
| Muscle (ALMI) (5.85) | ~14th | ~20th | ~20th |
Reading Jane's table: Her body fat ranks around the 60th percentile for her age group — she's leaner than 60% of women 40–59. Not bad, but not great. Her muscle (ALMI) at the ~14th–20th percentile is the bigger concern — she has less muscle than 80–86% of women her age. This is common in people who aren't resistance training and exactly the kind of insight that drives intervention.
Visceral Fat Assessment
This is the most clinically significant section of the report. Visceral fat is the fat stored deep inside your abdomen, surrounding your organs. You can't see it or pinch it, but it's metabolically active and drives inflammation, insulin resistance, and cardiovascular risk.
VAT Area
102.5 cm²
ModerateVAT Mass
1.09 lbs
Actual weight of fat around your organs
A/G Ratio
0.75
FavorableVisceral Fat Risk Scale
A color-coded bar shows where you fall:
- Healthy: below 100 cm²
- Elevated: 100–160 cm²
- High: above 160 cm²
Jane is at 102.5 — just into the elevated zone. Actionable, not alarming.
What the A/G Ratio Tells You
This ratio compares how much fat you carry around your belly versus your hips and thighs (technically called the Android/Gynoid ratio). Below 1.0 means you store more fat in the lower body (generally better from a metabolic standpoint). Above 1.0 means you carry more centrally (higher risk).
Jane's 0.75 is favorable — despite elevated overall body fat, her fat distribution pattern is lower risk.
Page 3
LEAN MASS & METABOLIC INSIGHTS
Muscle Health Metrics
Lean Mass Index (LMI)
14.47 kg/m²
How much lean tissue you carry relative to your frame size. Jane's ~31st percentile means about 69% of women have a higher lean mass relative to their frame.
Arm & Leg Muscle Index (ALMI)
5.85 kg/m²
NormalLean mass in your arms and legs only, adjusted for height. This is the number doctors use to screen for age-related muscle loss — the kind that eventually affects mobility and independence. Below 5.45 for women flags potential concern. Jane's 5.85 is above the threshold — a win.
Lean : Fat Ratio
1.62
For every pound of fat, Jane carries 1.62 pounds of lean tissue. Higher is better. This ratio improves as you build muscle and lose fat.
Metabolic Insights
Because DEXA measures your actual lean mass, we can estimate your resting metabolic rate with far greater accuracy than generic online calculators.
Resting Metabolic Rate (RMR)
1,216 cal/day
Calories Jane's body burns at complete rest. Calculated using the Katch-McArdle formula, which uses lean mass instead of just height/weight.
Estimated Daily Calories by Activity Level:
These are starting points, not rigid rules. Your actual needs vary with intensity, stress, sleep, and goals.
Page 4
FUELING YOUR COMPOSITION
This page translates your body composition data into actionable nutrition targets — specifically protein, which is the single most important macronutrient for body composition improvement.
Daily Protein Target
102–140 g/day
Based on 1.6–2.2 g per kg of body weight
Per Meal (4 meals/day)
26–35 g/meal
Distribute evenly to maximize the muscle-building response
Why this matters
Most people undereat protein. Current evidence supports 1.6–2.2 g per kg of body weight per day for anyone doing resistance training or trying to improve body composition.
These targets are calculated from your actual body weight — not a generic recommendation. Combined with the calorie estimates from the previous page, you have a personalized starting framework for nutrition.
Important: These are general guidelines. Individual needs vary based on training intensity, health status, and goals. Consult a registered dietitian for personalized recommendations.
Page 5
BONE MINERAL DENSITY & LIMB BALANCE
Lumbar Spine (L1–L4)
The report breaks down bone mineral density for each lumbar vertebra individually. This is the most clinically relevant site for detecting early bone loss — especially important for women approaching menopause, when bone density decline accelerates.
| Region | BMD (g/cm²) |
|---|---|
| L1 | 0.735 |
| L2 | 0.798 |
| L3 | 0.845 |
| L4 | 0.882 |
| Total | 0.820 |
Whole Body BMD
1.058 g/cm²
Within expected range for Jane's age. The report uses Z-scores, which compare your bones to other women your age (rather than T-scores, which compare to peak bone mass at age 30). Z-scores are the recommended measure for premenopausal women.
Individual Limb Breakdown
This section compares left vs right sides to detect muscle imbalances. Differences greater than 10% warrant attention — they may indicate compensation patterns, old injuries, or dominant-side overuse.
Flagged as asymmetry >10%. May warrant exercises that work one arm at a time to bring the weaker side up.
Balanced — under 10% difference. No intervention needed.
Why this matters: Muscle imbalances don't just affect aesthetics — they change how you move. Asymmetries increase injury risk during training and daily activities. Identifying them with data lets you target the problem directly.
Pages 6 & 7
YOUR SCORECARD & NEXT STEPS
The Scorecard
Page 6 consolidates every key metric into one table with a status badge (Elevated, Moderate, Normal, Favorable) and a trend column. On your first scan, every trend says "Baseline." On follow-up scans, you'll see arrows showing improvement or decline — this is where the longitudinal power of DEXA really kicks in.
Wins
- Appendicular lean mass is above the sarcopenia threshold
- Bone density within expected range for age
- Android/gynoid ratio is favorable
Areas for Attention
- Body fat is Elevated — consider nutrition and exercise optimization
- Visceral fat is moderately elevated — prioritize aerobic activity
- Lean mass asymmetry detected in arms (>10% difference)
This is the section most people photograph and stick on their fridge. Clear wins to feel good about, clear areas to target. No ambiguity.
Personalized Next Steps
Page 7 gives you specific, actionable recommendations based on your findings — not generic advice. Jane's report recommends:
Body Composition Support
Discuss whether medical or nutritional interventions might help optimize her elevated body fat percentage.
Visceral Fat Reduction
Targeted aerobic exercise and metabolic nutrition strategies can meaningfully reduce visceral fat within 3–6 months.
Movement Assessment
The arm asymmetry finding suggests a movement assessment could identify compensation patterns and guide corrective exercise.
Schedule Follow-up Scan
Track progress with a follow-up DEXA in 6–12 months. Consistent monitoring is the best way to measure impact.
Each recommendation includes a QR code that links directly to the relevant service page, so you can learn more or book right from the report.
Page 8
CLINICAL DATA — FOR YOUR PROVIDER
The final page is a reference sheet with the raw data in grams — the same format your doctor or specialist would see in a clinical setting.
It includes the full regional breakdown (fat, lean, bone mineral content, and total mass for each body region), android/gynoid composition details, visceral fat measurements, and scan metadata (machine model, software version, calibration factors).
You don't need to interpret this page yourself — it exists so that any provider reviewing your report has the complete clinical dataset without needing to request the raw scan files.
What's on this page:
- Regional body composition table — Fat, lean, and BMC in grams for each arm, leg, trunk, and head
- Android/gynoid detail — Exact fat and lean mass for the android and gynoid ROIs
- Visceral fat data — VAT mass, volume, area, subcutaneous fat area, total abdominal fat area
- Scan metadata — Operator, protocol, software version, machine model, calibration factors (ACF/BCF)
WHAT MAKES THIS REPORT DIFFERENT
It's personalized, not generic
Protein targets, calorie estimates, and next steps are calculated from your actual body composition — not plugged into a generic BMI calculator.
Every number reads the same way: higher is better
Our population rankings are normalized so you never have to guess whether a high score means you're doing well or doing poorly. Higher percentile = better, for every metric.
It gets better over time
Your second scan unlocks trend tracking — change in fat, lean mass, visceral fat, and bone density from scan to scan. This is where the real value compounds.
It tells you what to do
Data without context is just noise. Every report ends with a clear scorecard, wins to celebrate, areas to address, and specific next steps with direct links to relevant services.
SEE YOUR OWN NUMBERS
7-minute scan. 8-page personalized report. Typically same day.
$150 | Moonshot Medical & Performance | Park Ridge, IL
Book DEXA Scan